Deep Learning Dude pt 1

You’ve probably noticed that Deep Learning is all the rage right now. AlphaGo has beaten the world champion at Go, you can google cat photos and be sure you won’t accidentally get photos of canines, and many other near-miraculous feats: all enabled by Deep Learning with neural nets. (I am thinking of coining the phrase “laminar learning” to add some panache to old-school non-deep learning.)

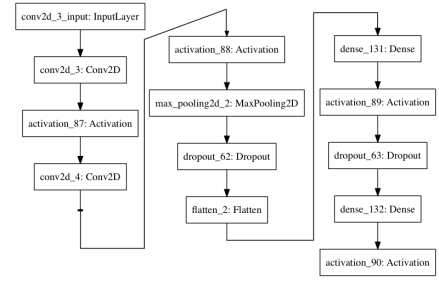
I do a lot of my work in R, and it turns out that not one but two R packages have recently been released that enable R users to use the famous Python-based deep learning package, Keras: keras and kerasR.

model2

Continue reading

BRMS continues its streak

As you probably know, I’m a big fan of R’s brms package, available from CRAN. In case you haven’t heard of it, brms is an R package by Paul-Christian Buerkner that implements Bayesian regression of all types using an extension of R’s formula specification that will be familiar to users of lm, glm, and lmer. Under the hood, it translates the formula into Stan code, Stan translates this to C++, your system’s C++ compiler is used to compile the result and it’s run.

screen-shot-2016-11-20-at-4-38-05-pm

brms is impressive in its own right. But also impressive is how it continues to add capabilities and the breadth of Buerkner’s vision for it. I last posted something way back on version 0.8, when brms gained the ability to do non-linear regression, but now we’re up to version 1.1, with 1.2 around the corner. What’s been added since 0.8, you may ask? Here are a few highlights:

Continue reading

Donoho nails Data Science! Mostly.

Just a quick note: In his recent (when I wrote this but neglected to publish it) paper, 50 Years of Data Science, David Donaho pretty much nails key foundations of Data Science and how it’s different from (just) Statistics or even (just) Machine Learning. I highly recommend that you read it.

It’s full of great quotes like this:

“… In those less-hyped times, the skills being touted today were unnecessary. Instead, scientists developed skills to solve the problem they were really interested in, using elegant mathematics and powerful quantitative programming environments modeled on that math. Those environments were the result of 50 or more years of continual refinement, moving ever closer towards the ideal of enabling immediate translation of clear abstract thinking to computational results.

“The new skills attracting so much media attention are not skills for better solving the real problem of inference from data; they are coping skills for dealing with organizational artifacts of large-scale cluster computing. …”

Great stuff.

BRMS 0.8 adds non-linear regression

Just a quick posting following up on the brms/rstanarm posting. In brms 0.8, they’ve added non-linear regression. Non-linear regression is fraught with peril, and when venturing into that realm you have to worry about many more issues than with linear regression. It’s not unusual to hit roadblocks that prevent you from getting answers. (Read the Wikipedia links Non-linear regression and Non-linear least squares to get an idea.)

BRMS Diagnostic
Continue reading

R Users Will Now Inevitably Become Bayesians

There are several reasons why everyone isn’t using Bayesian methods for regression modeling. One reason is that Bayesian modeling requires more thought: you need pesky things like priors, and you can’t assume that if a procedure runs without throwing an error that the answers are valid. A second reason is that MCMC sampling — the bedrock of practical Bayesian modeling — can be slow compared to closed-form or MLE procedures. A third reason is that existing Bayesian solutions have either been highly-specialized (and thus inflexible), or have required knowing how to use a generalized tool like BUGS, JAGS, or Stan. This third reason has recently been shattered in the R world by not one but two packages: brms and rstanarm. Interestingly, both of these packages are elegant front ends to Stan, via rstan and shinystan.

This article describes brms and rstanarm, how they help you, and how they differ.

BRMS Diagnostic 1
Continue reading

Map Projections

The Earth is round, and maps are flat. That’s a problem for map makers. And a source of endless entertainment for geeks.

World Map

Carlos A. Furuti has an excellent website with many projections and clear explanations of the tradeoffs of each. The main projection page has links to all types, including two of my favorites: Other Interesting Projections, and Projections on 3D Polyhedra. Enjoy!

In R, the packages maps and mapproj are your entrée to this world. I created the above map (a Mollweide projection, which is a useful favorite), with:

library (maps)
library (mapproj)

map ("world", projection="mollweide", regions="", wrap=TRUE, fill=TRUE, col="green")
map.grid (labels=FALSE, nx=36, ny=18)

Real Data Science pt1: Review of Numbersense

So far, when I’ve written on Data Science topics I’ve written about the fun part: the statistical analysis, graphs, conclusions, insights, etc. For this next series of postings, I’m going to concentrate more on what we can call Real Data Science®: the less glamorous side of the job, where you have to beat your data and software into submission, where you don’t have access to the tools or data you need, and so on. In other words, where you spend the vast majority of your time as a Data Scientist.

I’ll start the series with a review of Kaiser Fung’s Numbersense, published in 2013. It’s not mainly about Real Data Science, but I’ll start with it because it’s a great book that illustrate several common data pitfalls, and in the epilogue Kaiser shares one of his own Real Data Science stories and I found myself nodding my head and saying, “Yup, that’s how I spent several days in the last couple of weeks!”

IMG_1078
Continue reading

Book recommendation: Longitudinal Structural Equation Modeling

Longitudinal Structural Equation Modeling, Todd D. Little, Guilford Press 2013.

Let me start by saying that this is one of the best textbooks I’ve ever read. It was written as if the author was our mentor, and I really get the feeling that he’s sharing his wisdom with us rather than trying to be pedagogically correct. The book is full of insights on how he thinks about building and applying SEMs, and the lessons he’s learned the hard way.

LittleBook
Continue reading

Children’s science fiction and fantasy: it’s not just for children anymore!

Larklight Cover

My wife and I have started listening to books on audio during car trips or in the evening, and we’ve discovered that there are some absolute gems in the children’s literature section of the library. Yep, kid’s stories aren’t just for kids anymore. (And I wish I’d had stories like this when I was growing up!) In particular, we’ve been listening to audio CD’s and several of them have superb a voice acting that really enhances the story. These stories show incredible imagination, and in this posting I’d like to highly recommend two series: The Larklight Trilogy and the Bartimaeus Sequence, especially the audio CD’s.

Continue reading

Excellent article on Percolation Thresholds, using R

Percolation is the ability of a liquid-like substance to get through a solid-like lattice. An interesting question is how the likelihood of a material allowing percolation changes as the average density of the lattice changes from 100% (i.e. solid with no percolation) to 0% (i.e. nothing with total percolation). Read an interesting article that looks at the case of square lattices using R: Percolation Threshold on a Square Lattice

Energy Management in Laptops

I just upgraded to MacOS X Mavericks and can highly recommend it. It’s an amazing update, especially considering it’s free. You may not be a Mac user, but one thing that is quite interesting is the degree that Apple has gone to save battery power in Mavericks.

Here’s a screen capture of the Activity Monitor’s Energy tab (click on it to see it full-sized):

Screen Shot 2013-10-22 at 4.00.43 PM
Continue reading

Constraint Programming tool advice?

I’m working on a scheduling project and have so far been using linear programming tools. As I look down the road, I’m beginning to think that I’ll need to supplement or move beyond LP, perhaps with something like constraint programming (CP) techniques. Unfortunately, the CP arena seems to be littered with tools that are highly-spoken of but are no longer (or barely) supported. Anyone out there who can address CP tools?

So far, I’m leaning towards OscaR, because it seems fairly complete and it’s in Scala which is the Official General-Purpose Language of Thinkinator. I’ve looked at a variety of CP tools like Zinc (seems dead) and MiniZinc (seems barely alive), Geocode (C++), JaCoP (java-based), Choco (java-based), Comet (seems dead), etc. It’s a bit worrisome when I compare the level of activity and the apparent long-term stability of these projects to linear programming (Symphony, glpsol, lpsolv, etc).

Any experiences or insights on CP tools? (I’d prefer standalone tools with high-level syntax or Scala/Java-based tools, and not C++/Prolog-based tools.) Thanks!

Knots, Knots, and Avast ye Landlubbers

Several years ago I became interested in mathematical knot theory, so I got a book called The Knot Book by Adams. I also got the Ashley Book of Knots by Clifford Ashley, which is a 600-page encyclopedia of actual knots in ropes/string/etc. I’d forgotten about both books until last night, when a key plastic piece on our bedroom blinds broke: the part that joins the lower single cord to the upper multiple cords that actually go to the blinds.

I whipped out the Ashley Book and found the perfect bend, #1463, which is good for joining two cords that have different thickness. I’ve shown my results below, but note that the actual knot is in the upper left and the rest of it is just my quick work to make sure that the thicker piece stays bent and doesn’t straighten out and try to pull through. I don’t think Ashley would approve of that part.

My KnotCU
Continue reading

Where’s the Magic? (EMD and SSA in R)

When I first heard of SSA (Singular Spectrum Analysis) and the EMD (Empirical Mode Decomposition) I though surely I’ve found a couple of magical methods for decomposing a time series into component parts (trend, various seasonalities, various cycles, noise). And joy of joys, it turns out that each of these methods is implemented in R packages: Rssa and EMD.

In this posting, I’m going to document some of my explorations of the two methods, to hopefully paint a more realistic picture of what the packages and the methods can actually do. (At least in the hands of a non-expert such as myself.)

spiro2
Continue reading

Three-month forecasts to monthly estimates

In a previous series of postings, I described a model that I developed to predict monthly electricity usage and expenditure for a condo association. I based my model on the average monthly temperature at a nearby NOAA weather station at Ronald Reagan Airport (DCA), because the results are reasonable and more importantly because I can actually obtain forecasts from NOAA up to a year out.

The small complication is that the NOAA forecasts cover three-month periods rather than single month: JFM (Jan-Feb-Mar), FMA (Feb-Mar-Apr), MAM (Mar-Apr-May), etc. So, in this posting, we’ll briefly describe how to turn a series of these overlapping three-month forecasts into a series of monthly approximations.

temps3temps1
Continue reading

Scala + Eclipse + sbt on a Mac

Scala is now the official general-purpose programming language of thinkinator. I still really like R and use it every day, but it’s not a great choice for a general-purpose programming language. I wanted to adopt a language that runs on the JVM (Java, Scala, Clojure, Groovie, et al) that’s fun to use, but deep. Clojure is tempting — I love Lisp — but ultimately, Scala won out. I can highly recommend it!
Screen Shot 2013-09-06 at 10.29.37 PM Continue reading

So you think you know what you are?

Microbiome. Look up the definition on Wikipedia. Then go to Nuit Blanche and watch the second video.

Turns out that 90% of the cells in our bodies are not ours. They are various microorganisms that inhabit our bodies and have a positive or negative impact. This might not surprise you, but what kind and how large of impact they have might surprise you. And either delight or scare you.

Fun with R and HMM’s

I’m always intrigued by techniques that have cool names: Support Vector Machines, State Space Models, Spectral Clustering, and an old favorite Hidden Markov Models (HMM’s). While going through some of my notes, I stumbled onto a fun experiment with HMM’s where you feed a bunch of English text into a two-state HMM and it will (tend to) discover what letters are vowels.
bw1
Continue reading

Stata’s Forecast command

One of the great new features in Stata 13 is a command called forecast. This is not just another version of predict, it’s more like a forecast system management/dependency tool. You can take one or more regressions and deterministic equations and forecast takes your exogenous variables, pulls their values from your data set, feeds them into the equations/regressions that use them, take the resulting endogenous variables and feeds them into the equations/regressions that use them, chaining together a whole multi-part forecast. It also has tools for testing alternative scenarios, for inserting shocks and other modifications of endogenous variables, and for calculating confidence intervals of the system via simulation.

Dollars Forecast
Continue reading

Stata for R users pt 3

In Part 1 of this series, I listed a bunch of Stata strengths that appealed to me as a long-time R user. In Part 2, I gave thoughts and tips for R users who are new to Stata. As I was writing Part 2, I realized that I had left several important strengths out of Part 1, and wanted to add them, and also to expand on one of the new Stata 13 features, forecast. (Something that goes way beyond the usual predict.)

Dollars Forecast
Continue reading

Stata for R users pt 2

In Part 1 of this Stata for R users series, I mentioned many of the strengths of Stata that might be attractive to R users. I forgot several important strengths, which I’ll add and expand in Part 3. The more I work with it, the more I’m impressed with Stata.

In this Part 2, as promised, I’ve listed several thoughts and tips for R users who are new to Stata.

Stata 13 logo
Continue reading

Stata for R users pt 1

I did a quick Google search on “Stata for R users” (both as separate words and as a quoted phrase) and there really isn’t much out there. At best, there are a couple of equivalence guides that show you how to do certain tasks in both programs. (Plus a whole lot of “R for (ex-) Stata users” articles.) I’m writing this post, as a long-term R user who recently bought Stata, because I believe that Stata is a good complement to R, and many R users should consider adding it to their toolbox.

I’m going to write this in two parts. Part one will describe why an R user might be interested in Stata — with various Stata examples. Part Two will give specific tips and warnings to R users who do decide to use Stata.
Stata 13 logo Continue reading

A secret underground “lair” in DC

When visitors come to the Washington, DC, area I like to have an off-the-beaten-path option for them. Something that most people would just walk or drive by and not notice. One of these options used to be the Einstein Statue, but recently they’ve redone the landscaping so it’s much harder to miss as you drive down Constitution Avenue.

It turns out that there is a “secret” underground “lair” in DC that you can enter and feel almost like you’re in a James Bond movie. In the photo, below, note the inconspicuous little building between the Smithsonian Castle (on the left) and the Freer Gallery (on the right). Looks like a visitor’s welcome center or something, right?

Image

Continue reading

A silent lightning storm

Turns out that what we called “heat lighting” as kids — lightning that has no accompanying thunder — is simply lightning that’s more than about 10 miles away. Tonight, while we were out walking, there was a huge lightning storm about 25 miles north of us. There was so much lightning that it looked like it was a timelapse video. I taped 90 seconds on my phone and uploaded it to Youtube.
Silent Lightning Storm